August 18, 2015 17 min read
9 Important Training KPIs You Should be Tracking
Industry:
Solution:
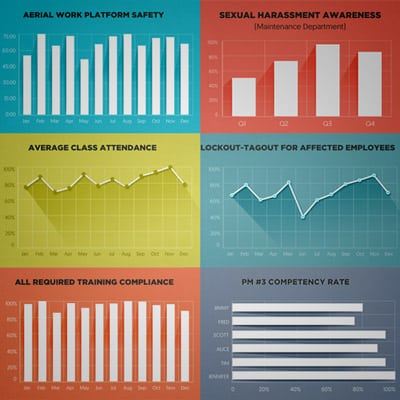
KPI stands for key performance indicator(s). KPIs are numerical ways to track the progress of a business as it strives to reach different business goals. KPIs have to be something you can count and measure objectively so that you can track progress.
A business as a whole may have its own set of KPIs. In addition, each site or department may also have its own KPIs. And so it stands to reason that the training department might/could/should have its own KPIs too. We’re going to look at a few of those in this article.
There are many different kinds of KPIs to track for a training program. Some focus on things that are directly related to training–like how many workers are complete or how many are overdue. Others focus on how the training program is affecting business results–like a comparison of profits or production or quality before and after a training program began.
In this article, we’re going to focus on those KPIs that are directly related to your training program, and in particular KPIs you can track using a learning management system (LMS). In future articles, we’ll look at some of those KPIs related to business results. If you’re not familiar with what an LMS is, the short video below will make it more obvious.
Having a learning management system (LMS) can make it very easy to track these training KPIs because they automatically capture training data and make it easy to generate reports. The same KPIs might be very hard to track accurately if you have training records in multiple spreadsheets, paper-based documents, and/or various computer systems.
Before you continue to read this article, feel free to download our free LMS Buyer’s Guide.

Vector EHS Management Software empowers organizations – from global leaders to local businesses – to improve workplace safety and comply with environmental, health, and safety regulations.
Learn more about how our software can save you valuable time and effort in recording, tracking, and analyzing your EHS activities.
Learn more about how we can help:
- Incident Management Software →
- EHS Inspection Software →
- Key Safety Metrics Dashboard →
- Learning Management System (LMS) and Online Training Courses →
- Mobile Risk Communication Platform
Download our EHS Management Software Buyer’s Guide.
Training KPIs to Track
Let’s look at a few of the KPIs you can track with an LMS to keep tabs of your training program and the training progress of the employees at your worksite.
Activity Pass/Fail Rate
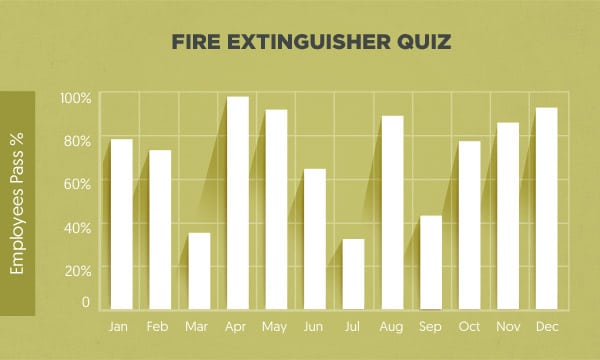
There are many reasons why you might want to see how many people are passing or failing an activity (such as a quiz).
For example, running this report over time, perhaps on a monthly or quarterly basis, will help you identify aberrations. If it’s typical that 80% of employees pass a specific test, and one month that suddenly drops to 40%, this may signal that something’s awry and you should investigate further. The sample report below illustrates this scenario.
In addition, you could run this report to show you pass/fail results on a compliance quiz at 12 different sites. This would let you identify sites where workers are passing at a high rate (and seemingly getting good training) and sites where workers are failing at a higher rate (and, perhaps, getting poorer training). You could then talk to the training manager at the sites with the poorer performances to begin to evaluate what’s going on.
Finally, you might want to run this report after creating a new quiz. This will help you evaluate if the quiz is too hard or too easy. If this quiz is too hard, the percentage of people who pass it will be too low. If this quiz is too easy, the percentage of people who pass it will be too high.
Average Test Score
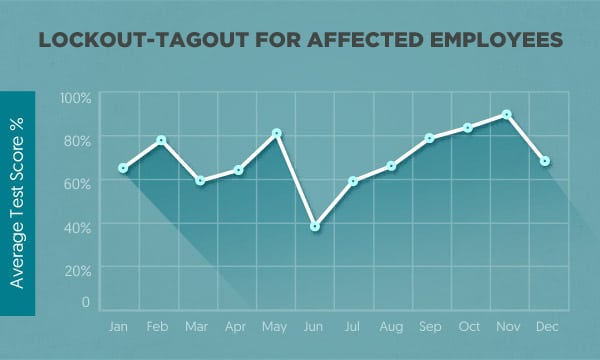
You could run this report to see the average test score for any number of reasons.
For example, maybe you’ve implemented a new change in your training program. Tracking test scores over time would allow you to see if the change has had a positive or negative effect.
In addition, if you run this report over time, and there’s suddenly an unexpected variation in average test scores, this may reflect a change out in the field. Maybe a new supervisor is sending a different message to workers when they’re on the job, or maybe a new production process that no longer matches your test has been put into place.
Training Completion Percentage Rate
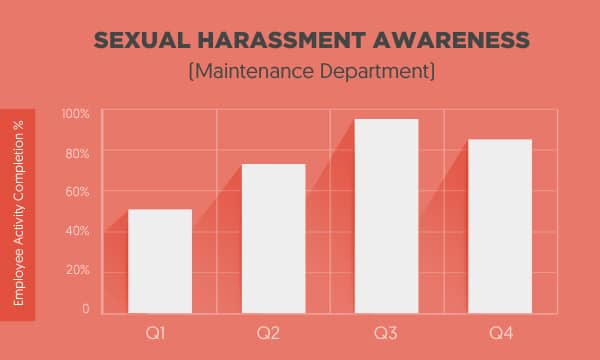
You might run a report to track completion of training every so often to make sure the training program isn’t being abandoned. If you run a seasonal business, such as construction or agriculture, you might expect training completion to dip at a certain time of year (summer for construction, fall for agriculture), but you’d expect to see those numbers pick up again after the busy season.
Another reason to run this report is related to compliance. For mandatory, compliance-based training, you’d expect the completion rate to be 100% every quarter. You can run this test a few weeks before the end of the quarter and, if the completion rate is less than 100%, alert department managers so they can make sure employees finish their required training on time.
<!–
Overview Training Assignment Rate
Another handy thing you can report on is which employees have completed an assignment before the due date and which have not (and are therefore overdue). You can run a report to see if an individual worker is complete or overdue for an activity, if a selection of workers are complete or overdue, or just run a report to identify all workers in overdue status.–>
Job Role Competency Rate
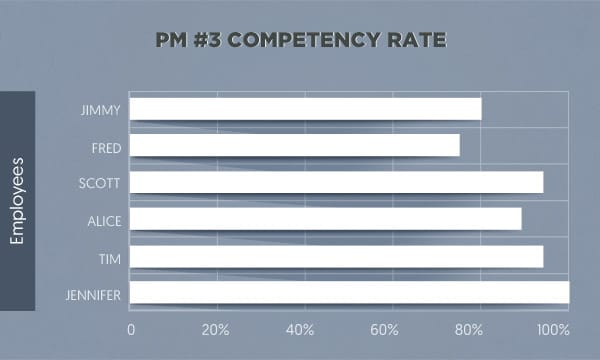
You can run a job role competency rate report to track the training progress of people in a given team or department. This is a great way to track their progress as they develop their job skills. It’s also a good way to identify people who are fully competent on a job role if your facility cross-trains people on multiple job roles and you need to identify a worker you can transfer to a different position to cover for someone who’s absent.
Departmental Job Competence Rate
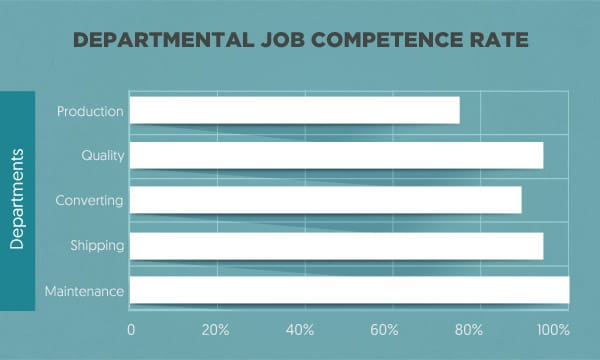
You can run this report to see the percentage of people in one or more department who are fully competent in their job role. Run it for one department to see if everyone in that department is competent, or run it for multiple departments to compare the competency rate across departments (this can help you identify departments that are more engaged in their training and self-improvement and those that are less so). This report can be very handy for training managers with responsibilities at an entire site.
Compliance Percentage Rate
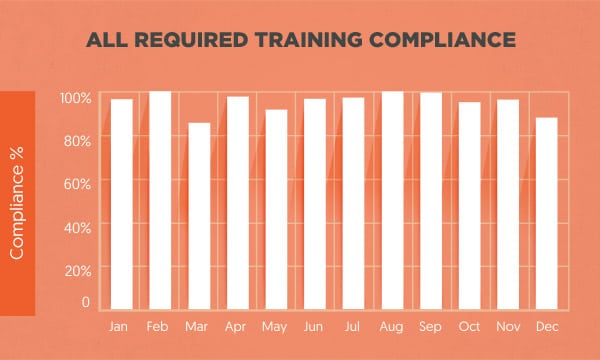
Training assignments are sometimes made in order to comply with regulatory training requirements. In that case, a training manager would want to know if employees had completed an activity (maybe by reading a document) or a series of activities (maybe by completing several activities related to EHS). You can run a compliance report to quickly determine if everyone’s completed mandatory compliance training. If not, you can alert their managers and ensure it is completed on time.
Class Attendance Rate
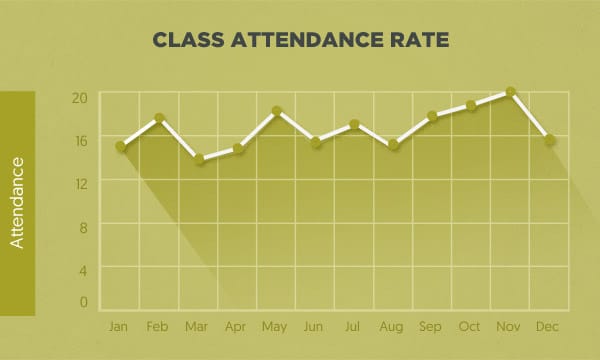
This might be a useful report to run if you have an optional, elective-based class you offer on a monthly basis. For example, maybe you offer leadership training each month and make 20 seats available per month. This report would give you the ability to track how popular the elective-based course is at your organization.
Average Time to Completion
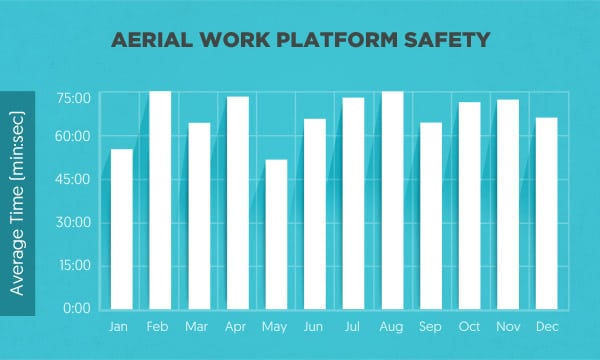
Running a report that lets you identify average completion time (or even total combined completion time) can be a key element of determining the ROI of training. Just take the number of people who have completed training, multiply it by their average completion time, and multiply that by average hour pay rate to begin determining the cost of training.
Conclusion: Training KPIs You Can Track with an LMS
Now you’ve seen quite a few ways you can use an LMS to track some of the critical KPIs for your training program. In this post, we focused on level 1 evaluations (learner reaction/survey sheets), level 2 evaluations (performance on tests), and a series of “expanded” level 2 evaluations, looking at things like completion, training time, compliance, and more.
It’s easy enough to see how this data could be useful and how convenient it is to have a software system automatically generate it for you. Even better, the LMS can be scheduled to send you the data on a recurrent basis (daily, weekly, or monthly, for example), always re-generating the reports, retrieving fresh and current data, and delivering it to your email inbox first thing in the morning.
You can also use this data to compare your training metrics over time or from site to site (or department to department). All of this data puts useful and actionable information at your fingertips, making your training efforts more productive.
If you’d like to learn even more about training KPIs and learning evaluation, check out our extended discussions on 4 Common Learning Evaluation Methods and Dr. Will Thalheimer’s LTEM Learning Evaluation Model.
If you’re currently using an LMS at work, use the comments section below to let us know the data you generate and evaluate for your own training program.


